JavaScript InfoVis Toolkit
Create Interactive Data Visualizations for the Web
Home
●
Download
●
Builder
●
Donate
Demos
Explore the Visualizations
Learn
Browse the Doc
Discuss
Join the Google Group
Contribute
Get Involved
Blog
News and Stuff
About
Bio and Contact
Area, Bar and Pie Charts
Stacked AreaChart
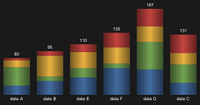
Vertical Stacked BarChart
Horizontal Stacked BarChart
Stacked PieChart
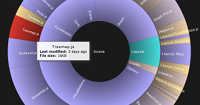
Sunburst
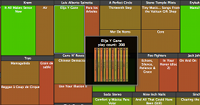
File System Visualization
Custom Nodes and Edges
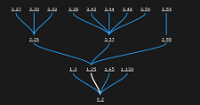
Icicle
Static Icicle Animation
File System Visualization
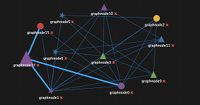
ForceDirected
Graph Manipulation
Graph Manipulation and Editing
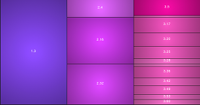
TreeMap
Squarified Animated Treemap
On-Demand Nodes
Cushion Treemap
SpaceTree
Tree Animation
On-Demand Nodes
Add/Remove Subtrees
Custom Style Animations
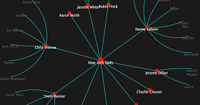
RGraph
Tree Animation
Weighted Graph Animation
Graph Operations
Drag and Drop Nodes
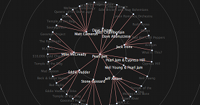
HyperTree
Tree Animation
Weighted Graph Animation
Graph Operations
Advanced/Other
Implementing NodeTypes
Composing RGraphs
Combinig SpaceTrees and RGraphs