Principles of Analytical Design
In the fifth chapter of Beautiful Evidence, Edward Tufte uses Charles Minard’s flow map to describe six Principles of Analytical Design.
Click here for a bigger image.
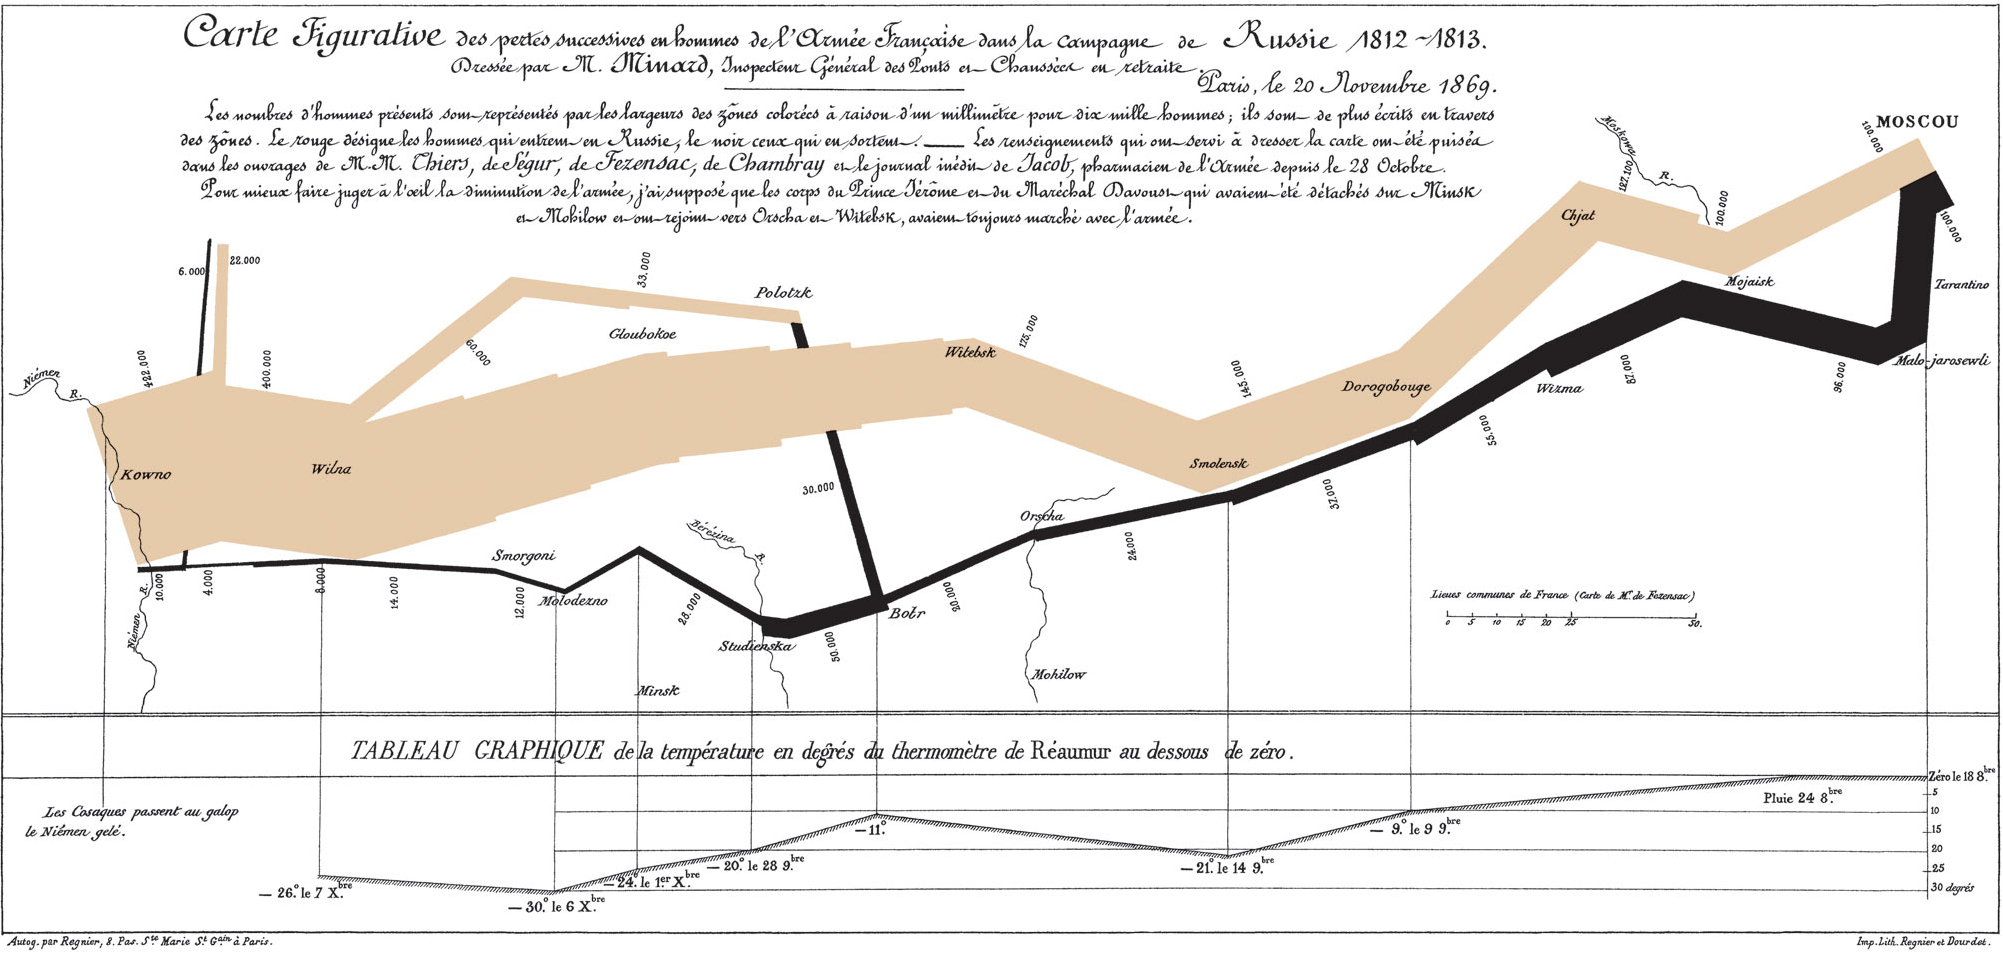
The visualization is a Figurative map of the successive losses in men of the French Army in the Russian campaign 1812-1813. Minard displays six variables in different visual encodings: the size of the army, its two-dimensional location (latitude and longitude), the direction of the army’s movement, and temperature on various dates during the retreat from Moscow.
The six Principles described in the Book are:
-
Comparisons - Show comparisons, contrasts, differences.
-
Causality, Mechanism, Structure, Explanation - Show causality, mechanism, explanation, systematic structure.
-
Multivariate Analysis - Show multivariate data; that is show more than 1 or 2 variables.
-
Integration of Evidence - Completely integrate words, numbers, images, diagrams.
-
Documentation - Thoroughly describe the evidence. Provide a detailed title, indicate the authors and sponsors, document the data sources, show complete measurement scales, point out relevant issues.
-
Content Counts Most of All - Analytical presentations ultimately stand or fall depending on the quality, relevance and integrity of their content.
Can you spot those principles in Minard’s Map?