
Hi! I'm Nicolas and I'm interested in information visualization, JavaScript and web standards.
I currently work as a Data Visualization Scientist at Twitter. I wrote PhiloGL, the JavaScript InfoVis Toolkit and V8-GL.


Euro 2012 Streamgraph B-sides
Posted in:
visualization
I worked on a data visualization for the 2012 European football champioship at Twitter that you can find here.
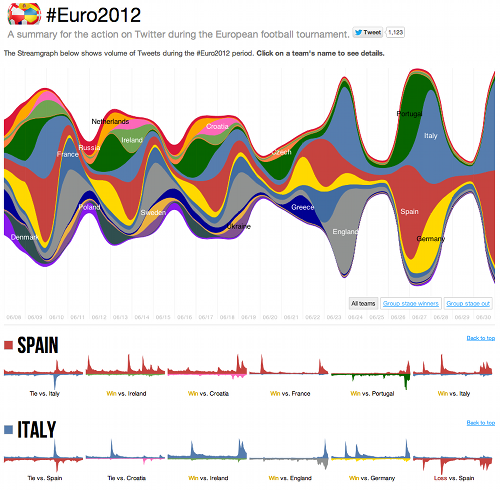
The visualization shows day-by-day data aggregated by country but also shows tweets per minute for each match of the tournament.
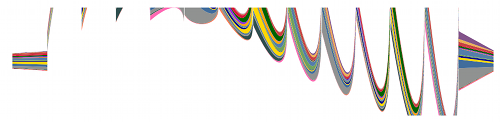
I made some tweaks to the JavaScript InfoVis Toolkit to create the StreamGraph visualization. During the process I made some mistakes that ended up in curious pseudo-visualizations like this ScribbleGraph:
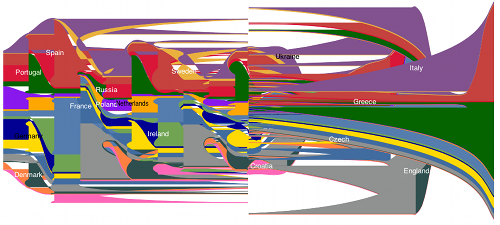
Or like this ScatteredFeatherGraph:

Or even this Windows solitaire tribute graph:
I’m thinking on writing a paper about these (not).