Graph Operations
Posted in:
javascript infovis toolkit
I've been working on the JavaScript Infovis Toolkit lately, fixing bugs, working on performance improvements and adding a new feature for Spacetrees, Hyperbolic Trees and RGraphs that I've found very interesting.
Mutable data
The JavaScript Infovis Toolkit is a JS Information Visualization library that includes radial layout of trees with animations, Treemaps, Hyperbolic Trees and Spacetrees. Not so long ago I worked on adapting these tree layouts to support graph layouts as well, also including weighted nodes and edges, as you can see in this example. However, one of the most challenging features I wanted to add to these visualizations was the possibility of dealing with mutable data. This way visualizations would also be useful to show how data changes over time, and updates to this data would be translated into smooth animations from one state of the graph to another. The user could also interact at a deeper level with the visualizations, not only exploring the data, but also altering it, making updates to the information and seeing the results in real time.The GraphOp object
The first thing that came into my mind when thinking on adding support for mutable data was prototyping the addSubtree and removeSubtree methods. These operations seem suitable for the Spacetree, (and have been implemented for this visualization), but what about applying transformations to graphs? Since the JIT adds support for graphs and trees in the RGraph and Hyperbolic Tree visualizations, both use cases should be well covered: adding and deleting subtrees as well as adding/deleting nodes, edges, and performing more general binary graph operations, such as graph sum and the one which I'm most proud of, morphing. So this new release of the library comes with the addSubtree and removeSubtree methods for the Spacetree, and also with the GraphOp object for the Hypertree and RGraph visualizations, which includes unary and binary operations such as:- removeNode Multiple nodes can be removed from the visualization. You can choose up to four different animations for doing that.
- removeEdge Multiple edges can be removed from the visualization. Supports many animations also.
- sum Performs a sum of two graphs, morphing the result with sequential or concurrent animations of movement and fading.
- morph A very useful operation in which you specify the resulting graph, and the visualization morphs the current graph state into that one.
Examples
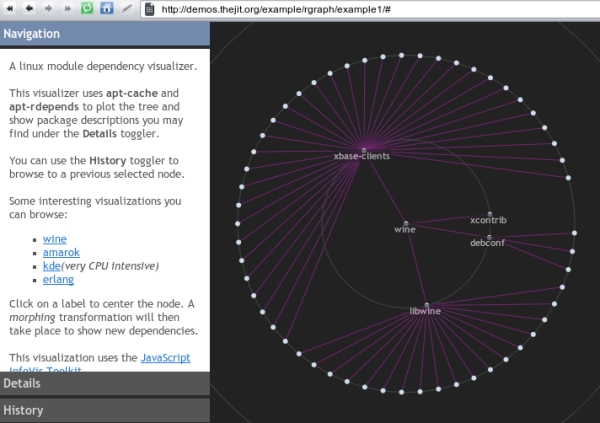
I chose to make two real life examples. With real life I mean small apps that not only show the potential of these graph operations, but can also be actually useful to explore. 1.- Linux module dependency visualizer It uses the RGraph visualization with the morphing operation to show dependencies between different modules you might find with the apt-get tool. When clicking on a node you'll set this node as root. Then the graph will perform a second animation, updating the dependencies for the new centered module. Many details about the package are also provided under the Details toggler. You can also go to previous visited modules by using the History toggler. These examples load data dynamically, so please be patient when loading the data. 2.- Visualizing relations between artists and bands dinamically
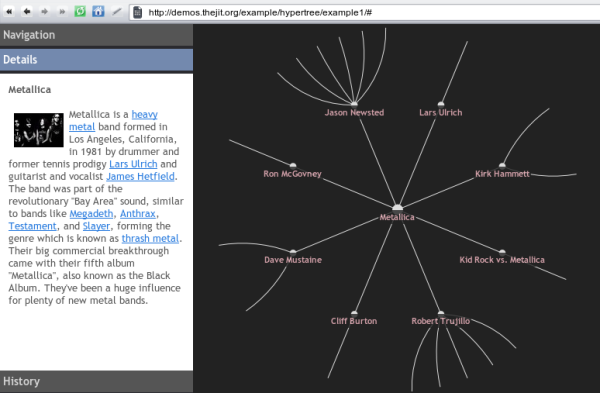
Just as the old demos I made an app that relates bands and artists by common performances on bands, discs, songs, etc.
Clicking on a label will set the node as root. Then a second animation will take place, morphing the tree into the new node's perspective.
Just as the previous example, you can find some information about the artists in the Details toggler. You can also browse previous visited nodes by clicking in the History toggler.
 All tutorials and posts have been updated for this new release. You can find more information in the project page and in the google group.
Although this library is still in alpha, some companies and products are already using it, such as OpenCRX and Platform Computing.
I'll be writing a more technical overview of these features in further posts.
Hope you liked it :)


