Visualizing Linux package dependencies
Posted in:
javascript infovis toolkit
, demo
, tutorial
I've been building a Linux package dependency visualizer with Python and the JavaScript Infovis Toolkit that gathers all dependencies for a linux package and displays them in an interactive tree visualization.
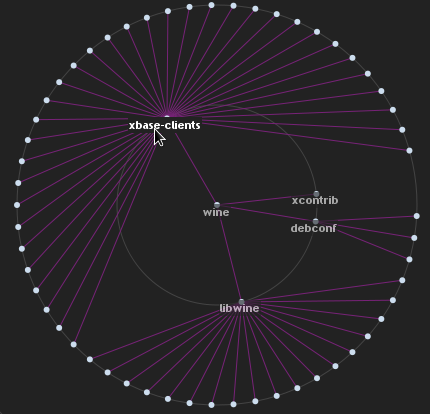
So, let's say your query is wine and you want to see dependencies for that package. The visualization will display wine as the centered node, laying its dependencies on outer concentric circles like this:
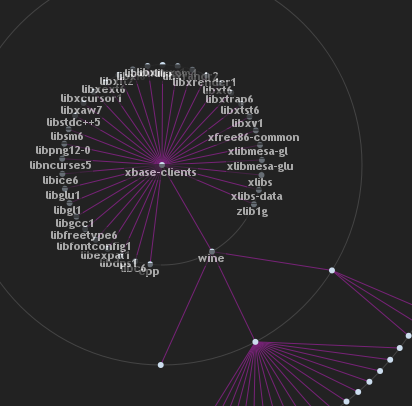
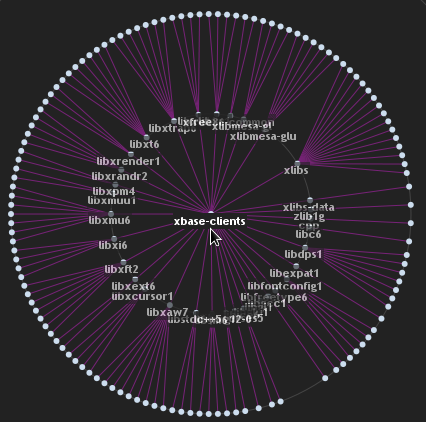
 By clicking on xbase-clients you'll set this node as root:

 You can play with the example here.
I'll explain how to build this in case you want your own at home.
I guess this is going to be also a nice tutorial on how to configure the RGraph visualization to run advanced examples, including the new morphing animations in version 1.0.7a.
Server Side
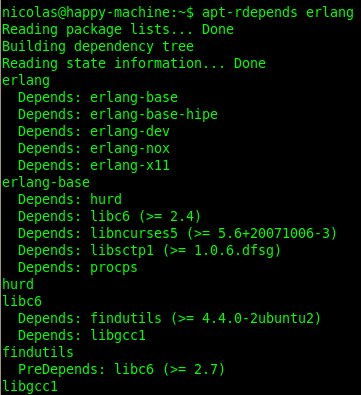
Server side we need to build a service that can transform the apt-rdepends output for package dependencies into a JSON tree structure. The apt-rdepends is a linux tool (which you can install with apt-get install apt-rdepends) that displays a hierarchy of package dependencies for a given package. Here's an example when querying for erlang: You can either use popen2 or commands.getoutput to fetch the output for a system call in Python, I'll do the latter.
The main function that makes the system call and returns the answer could be something like this:
def get_dependency_tree(package=''):
    out = commands.getoutput("apt-rdepends " + package).split("\n")
    ans = []
    #if dependencies were found for this package.
    if len(out) > 3 and out[3].strip() == package:
        ans = out[3:]
    else:
        ans = [package]
return make_tree(package=ans[0].strip(), source=ans, level=2)#returns a tree node
def make_tree_node(id, node_name):
node_name = node_name.strip()
return {
'id': id,
'name': node_name,
'children': [],
'data': []
}var json = {
"id": "aUniqueIdentifier",
"name": "usually a nodes name",
"data": [
{key:"some key", value: "some value"},
{key:"some other key", value: "some other value"}
],
children: [/* other nodes or empty */]
};def make_tree(package='', source=[], level=1, prefix=''):
node = make_tree_node(package + '_' + prefix, package)
if level > 0:
deps = get_package_deps(package, source)
[node['children'].append(make_tree(elem, source, level -1, package)) for elem in deps]
return nodedef get_package_deps(package_name='', source=[]):
ans, found_package_name = [], False
#test if is a dependency line
dependency = lambda package: package.strip().startswith('Depends:')
for line in source:
#package name line
if not found_package_name and package_name == line.strip():
found_package_name = True
#it's a package dependency, add its name to the answer
elif found_package_name and dependency(line):
ans.append(line.split("Depends: ")[1].split("(")[0].strip())
#end of dependency lines
elif found_package_name and not dependency(line):
return ans
return ansdef apt_dependencies(request, mode, package):
json = aptdependencies.get_dependency_tree(package)
json_string = simplejson.dumps(json)
return render_to_response('raw.html', { 'json' : json_string })Client Side
All the JavaScript Infovis Toolkit visualizations are customizable via controller methods. If this is the first time you use this library, perhaps it would be better to start with the RGraph quick tutorial first. First we define a simple Log object, that will write the current state of the graph to a label (like loading... or stuff like that). I'll use Mootools, but you can use whatever you want.var Log = {
elem: false,
getElem: function() {
return this.elem? this.elem : this.elem = $('log');
},
write: function(text) {
var elem = this.getElem();
elem.set('html', text);
}
};function init() {
//Set node radius to 3 pixels.
Config.nodeRadius = 3;
//Create a canvas object.
var canvas= new Canvas('infovis', '#ccddee', '#772277');
//Instanciate the RGraph
var rgraph= new RGraph(canvas, {
//Here will be stored the
//clicked node name and id
nodeId: "",
nodeName: "",
//Refresh the clicked node name
//and id values before computing
//an animation.
onBeforeCompute: function(node) {
Log.write("centering " + node.name + "...");
this.nodeId = node.id;
this.nodeName = node.name;
},
//Add a controller to assign the node's name
//and some extra events to the created label.
onCreateLabel: function(domElement, node) {
var d = $(domElement);
d.setOpacity(0.6).set('html', node.name).addEvents({
'mouseenter': function() {
d.setOpacity(1);
},
'mouseleave': function() {
d.setOpacity(0.6);
},
'click': function() {
if(Log.elem.innerHTML == "done") rgraph.onClick(d.id);
}
});
},
//Once the label is placed we slightly
//change the positioning values in order
//to center or hide the label
onPlaceLabel: function(domElement, node) {
var d = $(domElement);
d.setStyle('display', 'none');
if(node._depth <= 1) {
d.set('html', node.name).setStyles({
'width': '',
'height': '',
'display':''
}).setStyle('left', (d.getStyle('left').toInt()
- domElement.offsetWidth / 2) + 'px');
}
},
//Once the node is centered we
//can request for the new dependency
//graph.
onAfterCompute: function() {
Log.write("done");
this.requestGraph();
},
//We make our call to the service in order
//to fetch the new dependency tree for
//this package.
requestGraph: function() {
var that = this, id = this.nodeId, name = this.nodeName;
Log.write("requesting info...");
var jsonRequest = new Request.JSON({
'url': '/service/apt-dependencies/tree/'
+ encodeURIComponent(name) + '/',
onSuccess: function(json) {
Log.write("morphing...");
//Once me received the data
//we preprocess the ids of the nodes
//received to match existing nodes
//in the graph and perform a morphing
//operation.
that.preprocessTree(json);
GraphOp.morph(rgraph, json, {
'id': id,
'type': 'fade',
'duration':2000,
hideLabels:true,
onComplete: function() {
Log.write('done');
},
onAfterCompute: $empty,
onBeforeCompute: $empty
});
},
onFailure: function() {
Log.write("sorry, the request failed");
}
}).get();
},
//This method searches for nodes that already
//existed in the visualization and sets the new node's
//id to the previous one. That way, all existing nodes
//that exist also in the new data won't be deleted.
preprocessTree: function(json) {
var ch = json.children;
var getNode = function(nodeName) {
for(var i=0; i<ch.length; i++) {
if(ch[i].name == nodeName) return ch[i];
}
return false;
};
json.id = rgraph.root;
var root = rgraph.graph.getNode(rgraph.root);
GraphUtil.eachAdjacency(root, function(elem) {
var nodeTo = elem.nodeTo, jsonNode = getNode(nodeTo.name);
if(jsonNode) jsonNode.id = nodeTo.id;
});
}
});
return rgraph;
}window.addEvent('domready', function() {
var rgraph = init();
new Request.JSON({
'url':'/service/apt-dependencies/tree/wine/',
onSuccess: function(json) {
//load wine dependency tree.
rgraph.loadTreeFromJSON(json);
//compute positions
rgraph.compute();
//make first plot
rgraph.plot();
Log.write("done");
rgraph.controller.nodeName = name;
},
onFailure: function() {
Log.write("failed!");
}
}).get();HTML and CSS
These are the HTML and CSS files I used to make this example/tutorial. The HTML:<!DOCTYPE html PUBLIC "-//W3C//DTD XHTML 1.0 Transitional//EN" "http://www.w3.org/TR/xhtml1/DTD/xhtml1-transitional.dtd">
<html xmlns="http://www.w3.org/1999/xhtml" xml:lang="en" lang="en">
<head>
<meta http-equiv="Content-Type" content="text/html; charset=UTF-8" />
<title>
Linux package dependency visualizer
</title>
<link type="text/blog/css" href="/static/blog/css/style.css" rel="stylesheet" />
<script type="text/javascript" src="/static/js/mootools-1.2.js"></script>
<!--[if IE]>
<script language="javascript" type="text/javascript" src="/static/js/excanvas.js"></script>
<![endif]-->
<script language="javascript" type="text/javascript" src="/static/js/core/RGraph.js"></script>
<script language="javascript" type="text/javascript" src="/static/js/example/example-rgraph.js"></script>
</head>
<body onload="">
<canvas id="infovis" width="900" height="500"></canvas>
<div id="label_container"></div>
</body>
</html>
<div id="log"></div>html,body {
width:100%;
height:100%;
margin:0;padding:0;
background-color:#333;
text-align:center;
font-size:0.94em;
font-family:"Trebuchet MS",Verdana,sans-serif;
}
#infovis {
width:900px;
height:500px;
background-color:#222;
}
.node {
color: #fff;
background-color:#222;
font-weight:bold;
padding:1px;
cursor:pointer;
font-size:0.8em;
}
.hidden {
display:none;
}


