
Hi! I'm Nicolas and I'm interested in information visualization, JavaScript and web standards.
I currently work as a Data Visualization Scientist at Twitter. I wrote PhiloGL, the JavaScript InfoVis Toolkit and V8-GL.


Twitter's Political Engagement Map
Posted in:
javascript
, svg
, twitter
I worked on an exploratory data visualization at Twitter that tracks engagement in the US for tweets from the candidates. You can see the article on the Twitter blog here.
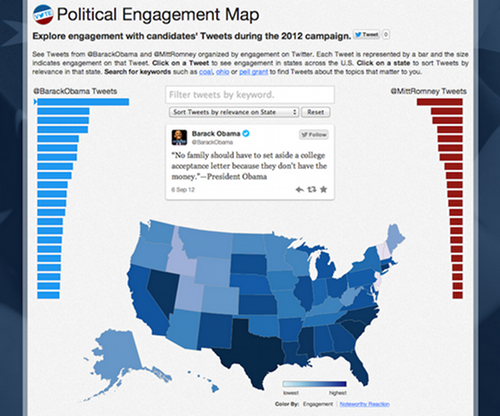
There are some interesting insights from the visualization summarized in the blog post too. For example, searching for tweets with the “coal” keyword shows more engagement on the states that are leading producers of coal:
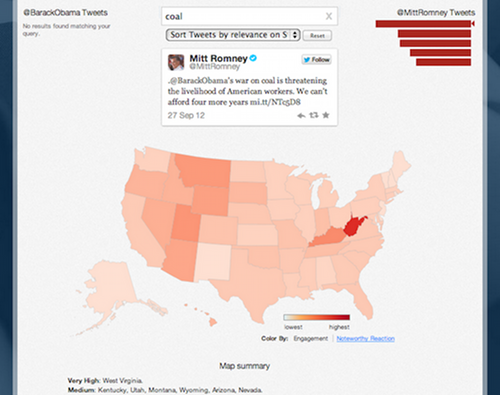
Other interesting searches ares ones for Pell Grant or God.
You can also take a look at the topics that interest more a given state by clicking on it. For example, here’s what we get about New York:

You can find more insights on the Twitter blog.