


Our entry for the Mozilla Open Data Visualization Challenge
Launch the Visualization by clicking here!
Maria Luz Caballero and me have been working together for a couple of weeks to create an interesting visualization for the Mozilla Open Data Visualization Challenge.
Mozilla is releasing a new version of Firefox, version 4. This new version introduces a new UI and they have been monitoring how users interact with the different UI components of Firefox 4. They gathered some interesting information about how UI components are accessed and other elements taken by a survey to the Firefox users describe their expertise level, age, place where Firefox is used, etc.
We decided that this information could be visualized as a TreeMap in which the area of each node is proportional to the number of times a UI component has been accessed. For example in this image we can see that around 20% of UI interactions happen in the Navigation Toolbar, and it’s possible to compare the area of this rectangle to others to give us a clue of the overall interactions:
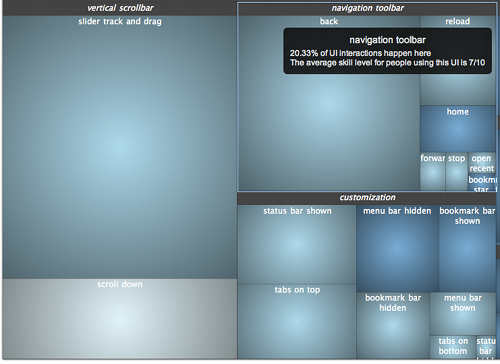
Each node also has a color that spans from red to blue, indicating an average of the expertise level of the user interacting with this component.

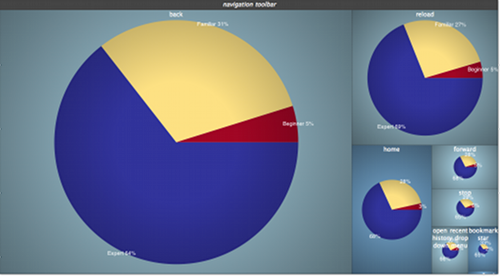
It’s interesting to note how some components are more often accessed by expert users than by beginners and viceversa. However since we provide an average we lack the information about the real distribution of user skills accessing the component. In order to avoid misleading results, when drilling down the TreeMap PieCharts indicate the real user skill distribution for each UI component interaction.
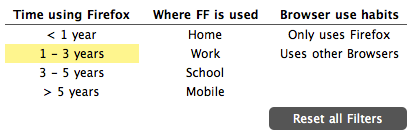
What I believe is by far the most interesting aspect of this visualization is the fact of using the ordinal and nominal information provided by the user survey to provide dynamic filtering for the TreeMap. Dynamic filtering (or morphing) enables an easy comparison between different categories of users on how they interact with these components. The filter panel we provide is shown below:
If you’re interested in taking a look at the visualization and playing with it please go to our entry. Browsers supported are Firefox 4, Opera 10.6+ and the latest of the Webkit family.