
Hi! I'm Nicolas and I'm interested in information visualization, JavaScript and web standards.
I currently work as a Data Visualization Scientist at Twitter. I wrote PhiloGL, the JavaScript InfoVis Toolkit and V8-GL.


Sunburst Visualization
Posted in:
javascript infovis toolkit
, visualization
In a previous post I showed the ForceDirected visualization I'm working on for version 1.2 of the JavaScript InfoVis Toolkit, today I'd like to talk about another visualization I've been working on, the Sunburst Visualization.
What's the Sunburst Visualization?
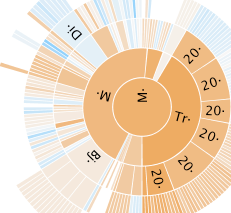
I guess an example could help here: A Sunburst visualization is a radial space-filling visualization technique for displaying tree like structures. There are other space-filling visualization methods that use other visual encodings for describing hierarchies. For example, the Treemap is a space-filling visualization that uses "containment" to show "parent-child" relationships. There are a couple of subtle changes that can improve the way the information is communicated by this visualization.- The "classic" Sunburst visualization uses horizontal labels for node names. One problem with this is that as I mentioned in a previous post labels can be occluded. One solution for this is to rotate labels in a way that they're not occluded.
-
A simple yet important thing to do when rotating labels is to rotate the labels in a way that they're always facing up.
In this example some labels are upside-down:
 A simple check could make labels more readable:
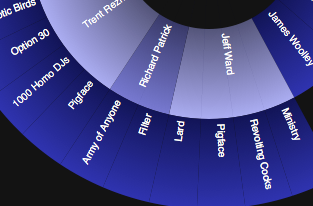
-
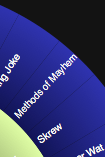
Another interesting thing that can be used with the Canvas Text API is the maxWidth parameter. This is an optional parameter that can be used to try to force the text to fit some width. I use this parameter when plotting the Sunburst visualization:
Node Styling and Behavior
The visualization also implements events for hovering and clicking nodes. You can also provide any number of styles to be smoothly updated when hovering and clicking nodes. There's also onClick and onHover callbacks that are called when a node is clicked or hovered respectively. For example, this is the configuration I used in the previous example:NodeStyles: {
attachToDOM: false,
attachToCanvas: true,
stylesHover: {
'color': '#d33'
},
stylesClick: {
'color': '#3dd'
},
onClick: function(node) {
//build right column relations list
buildRightColumnRelationsList(node);
//hide tip
sb.tips.tip.style.display = 'none';
//rotate
sb.rotate(node, 'animate', {
'duration': 1500,
'transition': Trans.Quart.easeInOut
});
}
},Tips: {
allow: true,
attachToDOM: false,
attachToCanvas: true,
onShow: function(tip, node, elem) {
tip.innerHTML = node.name;
}
},Collapsing and Expanding Subtrees
I've been also implementing animations for collpasing/expanding subtrees: The collapsing process reduces the angle span occupied by a parent node and sets its children alpha value to zero. There's also a visual mark set for collapsed nodes.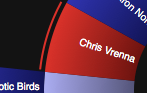 I hope you like this visualization. There's still much work to do, mostly regarding browser compatibility. I'll keep you up to date with the progress of this visualization and the next visualization I'll be implementing in the next post :)