HTML, SVG or Canvas Labels?
Posted in:
javascript infovis toolkit
, visualization
, javascript
As you might know, the JavaScript InfoVis Toolkit uses the HTML5 Canvas element for plotting and animating graphs. This is all very nice, Canvas performance compared to other techniques for plotting these things (SVG for example) is by far superior. But of course, there are drawbacks.
Canvas better performance is due to the fact that there are no tracked elements: the Canvas is simply an image and you're drawing there just like you'd be drawing something in paint. One big problem is that there's no native possibility to add events to what's drawn in Canvas, like a plotted node, edge or label.
As opposed to Canvas, SVG has a DOM/XML like spec: you have all these tags (<g> <text> <rect>) and each of them is just like a DOM element: you can add click event handlers, individual styling with CSS, etc.
Having to keep track of all these elements and handling a DOM-tree makes the performance of SVG not suitable for visualizing (and animating) medium to large datasets on the web.
Using HTML labels
Just like SVG, HTML is a DOM/XML-like spec, where you can add event handlers to each element. Also, every web developer knows HTML so exposing HTML labels through user-defined controller methods in the library seemed to me like a good choice. For controller methods like onCreateLabel or onPlaceLabel an HTML element is passed and the user can style or add event-handlers to it. For example, here's a fragment of the code used in the RGraph demo. You can see the rest of the code here://Add the name of the node in the correponding label
//and a click handler to move the graph.
//This method is called once, on label creation.
onCreateLabel: function(domElement, node){
domElement.innerHTML = node.name;
domElement.onclick = function(){
rgraph.onClick(node.id);
};
},
//Change some label dom properties.
//This method is called each time a label is plotted.
onPlaceLabel: function(domElement, node){
var style = domElement.style;
style.display = '';
style.cursor = 'pointer';
if (node._depth <= 1) {
style.fontSize = "0.8em";
style.color = "#ccc";
} else if(node._depth == 2){
style.fontSize = "0.7em";
style.color = "#494949";
} else {
style.display = 'none';
}
var left = parseInt(style.left);
var w = domElement.offsetWidth;
style.left = (left - w / 2) + 'px';
}- I'm using well known HTML elements.
- Dealing with DOM elements let's you add event handlers, individual styling and things like that.
- I'm using a DOM tree, which means that if labels are plotted at all times I'm exhaustively updating the DOM and this might lead to performance problems.
-
HTML is good for structuring pages, but for example you might want to apply transformations to HTML elements (like rotating labels, etc), and these aren't supported by all browsers yet.
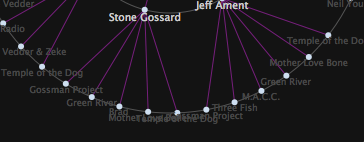
So one of the problems that might arise is, for example, the fact that in radial layouts labels might be occluded:

Using SVG labels
So I began exploring other possibilities to create labels. For this I abstracted the Label interface I had and split it into:- Graph.Label.Native (for native canvas labels)
- Graph.Label.DOM(abstract class for dom elements)
- Graph.Label.HTML(extends the DOM interface with HTML specific stuff)
- Graph.Label.SVG(extends the DOM interface with SVG specific stuff)
//Add the name of the node in the correponding label
        //and a click handler to move the graph.
        //This method is called once, on label creation.
        onCreateLabel: function(domElement, node){
            domElement.firstChild
              .appendChild(document
                .createTextNode(node.name));
            domElement.onclick = function(){
                rgraph.onClick(node.id, {
                  hideLabels: false
                });
            };
        },
        //Change some label dom properties.
        //This method is called each time a label is plotted.
        onPlaceLabel: function(domElement, node){
            var bb = domElement.getBBox();
            if(bb) {
              //center the label
              var x = domElement.getAttribute('x');
              var y = domElement.getAttribute('y');
              //get polar coordinates
              var p = node.pos.getp(true);
              //get angle in degrees
              var pi = Math.PI;
              var cond = (p.theta > pi/2 && p.theta < 3* pi /2);
              if(cond) {
                domElement.setAttribute('x', x - bb.width );
                domElement.setAttribute('y', y - bb.height );
              } else if(node.id == rgraph.root) {
                domElement.setAttribute('x', x - bb.width/2);
              }

              var thetap =  cond? p.theta + pi : p.theta;
                domElement.setAttribute('transform', 'rotate('
                + thetap * 360 / (2 * pi) + ' ' + x + ' ' + y + ')');
}- Just like with any other DOM element, you can add event handlers.
- You can apply transformations to labels.
- Performance, for the same reasons as HTML.
- IE does not support SVG.
Native Canvas labels
Native Canvas labels make use of the HTML5 Canvas text API to plot labels. Since the labels are just painted in the Canvas there's no DOM tree to update, and performance is good. The Canvas text API has fillText, strokeText and measureText as methods. You can read more about the Canvas Text API here. This is the code I added to the Graph.Label.Native class:Graph.Label.Native = new Class({
plotLabel: function(canvas, node, controller) {
var ctx = canvas.getCtx();
var coord = node.pos.getc(true);
ctx.fillText(node.name, coord.x, coord.y);
},
hideLabel: $empty
});- Opera does not support this feature.
- You can't natively add event handlers to labels. I think I've seen someone do something similar for text in processing, but I'm not sure there's a good way of doing this without keeping track of the position of each label and perform a check each time a click is triggered in the canvas element.
- I should change the way I define controller methods, in order to be able to pass a custom label object with x, y, theta, rho, width, height properties that could be modified on the fly, and then translate these changes into translate and rotate native canvas calls to be able to plot the text the way the user wants it. This seems just to damn complicated.... But I'll consider it.


