


Wind Motion Patterns
I’ve been working on a WebGL data visualization of wind motion patterns for a 72 hour period in the United States.
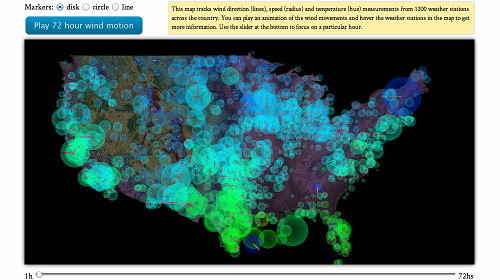
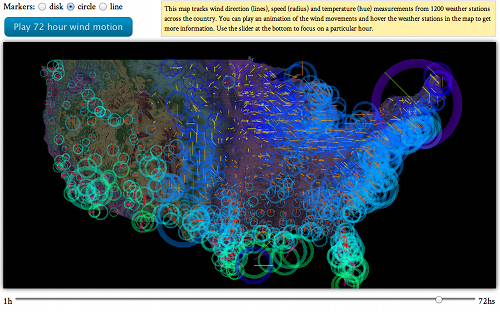
Gathering the data from the National Weather Service was pretty interesting, I didn’t know USA had so many weather stations! The visualization shows wind direction encoded in line angles, wind speed encoded in line lengths and disk radius, and temperature encoded in hue. All this for about 1200 weather stations across the country.
You can switch between different visual markers from the top menu, also play the wind motion for the 72 hours or select a specific time from the timeline below the graphic.
One interesting thing I found with this visualization is what appeared to be an outlier in the data, around mount Washington:
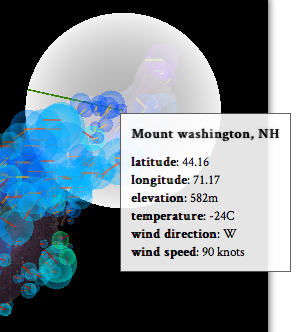
The data is seems actually correct after I took a look at the Wikipedia article for Mount Washington:
For 76 years, a weather observatory on the summit held the record for the highest wind gust directly measured at the Earth’s surface, 231 mph (372 km/h) (or 103 m/s)
With this example I also released a new version of the framework.