
Hi! I'm Nicolas and I'm interested in information visualization, JavaScript and web standards.
I currently work as a Data Visualization Scientist at Twitter. I wrote PhiloGL, the JavaScript InfoVis Toolkit and V8-GL.


Voronoi Tessellation
Posted in:
javascript
, visualization
This is going to be the first of a couple of posts related to Voronoi Tessellations, Centroidal Voronoi Tessellations and Voronoi TreeMaps. In this post I'll explain what a Voronoi Tessellation is, what can it be used for, and also I'll describe an interesting algorithm for creating a Voronoi Tessellation given a set of points (or sites as I'll call them from now on).
What is a Voronoi Tessellation?
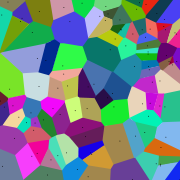 Given a set P := {p1, ..., pn} of sites, a Voronoi Tessellation is a subdivision of the space into n cells, one for each site in P, with the property that a point q lies in the cell corresponding to a site pi iff d(pi, q) < d(pj, q) for i distinct from j. The segments in a Voronoi Tessellation correspond to all points in the plane equidistant to the two nearest sites.
Voronoi Tessellations have applications in computer science, chemistry, etc. but I'm most interested in Voronoi Diagrams for constructing Voronoi TreeMaps (more on that in later posts).
Given a set P := {p1, ..., pn} of sites, a Voronoi Tessellation is a subdivision of the space into n cells, one for each site in P, with the property that a point q lies in the cell corresponding to a site pi iff d(pi, q) < d(pj, q) for i distinct from j. The segments in a Voronoi Tessellation correspond to all points in the plane equidistant to the two nearest sites.
Voronoi Tessellations have applications in computer science, chemistry, etc. but I'm most interested in Voronoi Diagrams for constructing Voronoi TreeMaps (more on that in later posts).
How do I create a Voronoi Tessellation?
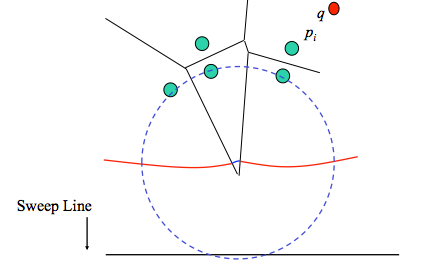
One algorithm for creating Voronoi Tessellations was discovered by Steven Fortune in 1986. This algorithm is described as a plane sweep algorithm. Fortune's Algorithm maintains both a sweep line (in red) and a beach line (in black) which move through the plane as the algorithm progresses. The structures used in this algorithm are an EventQueue, EdgeList and a binary Tree that tracks the state of the beach line.
The EventQueue stores two distinct type of events that are related to changes in the beach line. These events happen when:
The structures used in this algorithm are an EventQueue, EdgeList and a binary Tree that tracks the state of the beach line.
The EventQueue stores two distinct type of events that are related to changes in the beach line. These events happen when:
- A site s crosses the sweep line: in this case a new parabola with minimum at s is added to the beach line. A Voronoi Edge is born.
- A circle that touches three sites staying behind the sweep line is found and is tangent to the sweep line (see image below). A Voronoi Vertex is found.
 At each of these stages the EdgeList is updated until the algorithm is completed.
Implementations
I haven't found any interesting implementation of this algorithm in JavaScript. Actually, I didn't find a working implementation of this algorithm in JavaScript. There's this version of a JavaScript applet for making Voronoi Tessellations, but it doesn't seem to work right (the corners of the image generally hold two or more sites in the same cell). Also, the code was based in a C# implementation and isn't very pretty. Then there's this blog that mentions the algorithm but there's no visible implementation, just a JQuery demo that animates parabolas when a mouse crosses a site, but no Voronoi Diagram. So I made my own implementation, which I tried to make as similar as possible to the original C implementation from Steven Fortune. If you click on the image you can see it in action. Just refresh the page for new Voronoi Tessellations of random positioned sites. Any comments or advices about how to make this implementation better are welcomed!