
Hi! I'm Nicolas and I'm interested in information visualization, JavaScript and web standards.
I currently work as a Data Visualization Scientist at Twitter. I wrote PhiloGL, the JavaScript InfoVis Toolkit and V8-GL.


Force Directed Layouts
Posted in:
javascript infovis toolkit
, visualization
I'm currently working on three new visualizations for the JavaScript InfoVis Toolkit that will be added in version 1.2.
I started the development of these new visualizations a couple of weeks ago, and while trying to incorporate these new visualizations harmoniously into the Toolkit I've found myself considering new design and code abstractions I haven't thought about before. That's good for the Toolkit, and also good for my brain :)
One of the visualizations I'll be incorporating in the next major release is a Force-Directed visualization. I first want to thank Marcus Cobden for donating a lot of code related to this algorithm that you can find here.
My code is based in his donation and also in a nice overview of Force-Directed layout algorithms that I've found here.
So what are Force-Directed Layout Algorithms?
Force-Directed Layout algorithms are graph drawing algorithms based only on information contained within the structure of the graph itself rather than relying on contextual information. The most straightforward Force-Directed algorithm uses repulsive forces between nodes and attractive forces between adjacent nodes. This physical model produces some local minima in which the graph, well, gets to a stable configuration and is drawn in an aesthetically pleasing way. The main algorithm consists on a main loop that simulates the system for some iterations and then plots the graph. The system will consist on repulsive forces between all graph nodes and attractive forces between adjacent nodes. The force models considered correspond to Hooke's law and Coulomb's law. Here's an example with some JSON data I also use for other examples at the demos page: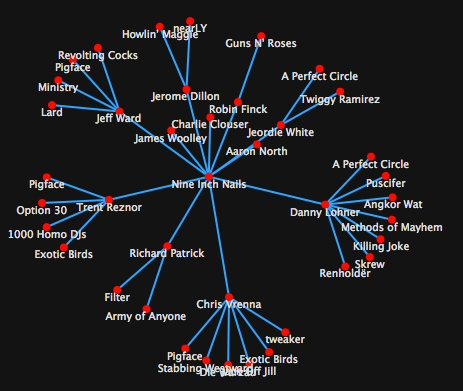 There are lots of refinements and different methods for making Force-Directed Layouts. Some are just based on the model I described before, others are based on what's called Graph Theoretic Distances: If for two adjacent nodes their ideal distance is set as d, then for nodes with shortest path distance of n their ideal layout distance should be n * d. Attractive and repulsive forces are used to make a graph system with random nodes positions get to a local minima based on these rules.
I implemented the first model I described. For each iteration the computePositionStep method is called to update all nodes positions based on attractive and repulsive forces. The formal parameters passed to the method are property which is an array of node properties which contain positions to be updated and opt which is an object containing layout options like generic repulsive and attractive force functions. $C creates a new Complex Number.
There are lots of refinements and different methods for making Force-Directed Layouts. Some are just based on the model I described before, others are based on what's called Graph Theoretic Distances: If for two adjacent nodes their ideal distance is set as d, then for nodes with shortest path distance of n their ideal layout distance should be n * d. Attractive and repulsive forces are used to make a graph system with random nodes positions get to a local minima based on these rules.
I implemented the first model I described. For each iteration the computePositionStep method is called to update all nodes positions based on attractive and repulsive forces. The formal parameters passed to the method are property which is an array of node properties which contain positions to be updated and opt which is an object containing layout options like generic repulsive and attractive force functions. $C creates a new Complex Number.
computePositionStep: function(property, opt) {
    var graph = this.graph, GUtil = Graph.Util;
    var min = Math.min, max = Math.max;
    var dpos = $C(0, 0);
    //calculate repulsive forces
    GUtil.eachNode(graph, function(v) {
      //initialize disp
      $each(property, function(p) {
        v.disp[p].x = 0; v.disp[p].y = 0;
      });
      GUtil.eachNode(graph, function(u) {
        if(u.id != v.id) {
          $each(property, function(p) {
            var vp = v.getPos(p), up = u.getPos(p);
            dpos.x = vp.x - up.x;
            dpos.y = vp.y - up.y;
            var norm = dpos.norm() || 1;
            v.disp[p].$add(dpos
                .$scale(opt.nodef(norm) / norm));
          });
        }
      });
    });
    //calculate attractive forces
    var T = !!graph.getNode(this.root).visited;
    GUtil.eachNode(graph, function(node) {
      GUtil.eachAdjacency(node, function(adj) {
        var nodeTo = adj.nodeTo;
        if(!!nodeTo.visited === T) {
          $each(property, function(p) {
            var vp = node.getPos(p), up = nodeTo.getPos(p);
            dpos.x = vp.x - up.x;
            dpos.y = vp.y - up.y;
            var norm = dpos.norm() || 1;
            node.disp[p].$add(dpos.$scale(-opt.edgef(norm) / norm));
            nodeTo.disp[p].$add(dpos.$scale(-1));
          });
        }
      });
      node.visited = !T;
    });
    //arrange positions to fit the canvas
    var t = opt.t, w2 = opt.width / 2, h2 = opt.height / 2;
    GUtil.eachNode(graph, function(u) {
      $each(property, function(p) {
        var disp = u.disp[p];
        var norm = disp.norm() || 1;
        var p = u.getPos(p);
        p.$add($C(disp.x * min(Math.abs(disp.x), t) / norm,
            disp.y * min(Math.abs(disp.y), t) / norm));
        p.x = min(w2, max(-w2, p.x));
        p.y = min(h2, max(-h2, p.y));
      });
    });
}for(var i=0; i < times; i++) {
opt.t = opt.tstart * (1 - i/(times -1));
this.computePositionStep(property, opt);
}Performance
Although there are a couple of methods to reduce the complexity of this algorithm, this implementation runs like O(V^3), which can be considered as really bad performance. This is not desirable for real-time interactive visualizations, in which everlasting computation algorithms can lead to blocking browser popups like "This Script is Taking too long..." or things like that. One way you can avoid these popups is by making incremental computations. This can be done by splitting the main algorithm that has for example 100 iterations into smaller pieces of 20 iterations each. The main iteration loop could then be changed into something like this:computePositions: function(property, opt, incremental) {
var times = this.config.iterations, i = 0, that = this;
if(incremental) {
(function iter() {
for(var total=incremental.iter, j=0; j<total; j++) {
opt.t = opt.tstart * (1 - i++/(times -1));
that.computePositionStep(property, opt);
if(i >= times) {
incremental.onComplete();
return;
}
}
incremental.onStep(Math.round(i / (times -1) * 100));
setTimeout(iter, 1);
})();
} else {
for(; i < times; i++) {
opt.t = opt.tstart * (1 - i/(times -1));
this.computePositionStep(property, opt);
}
}
}//compute positions incrementally and animate.
fd.computePositions(property, opt, {
iter: 20,
onStep: function(perc) {
Log.write(perc + '% loaded...');
},
onComplete: function() {
Log.write('done');
fd.animate();
}
});