
Hi! I'm Nicolas and I'm interested in information visualization, JavaScript and web standards.
I currently work as a Data Visualization Scientist at Twitter. I wrote PhiloGL, the JavaScript InfoVis Toolkit and V8-GL.


A new Canvas Element
Posted in:
javascript
, javascript infovis toolkit
A couple of days ago I released version 1.0.8a of the JavaScript InfoVis Toolkit, that introduces some API changes and nice features.
This version focus mainly on two things:
- A more stable and usable Canvas class.
- Finishing last features included in the Spacetree, Treemap and RGraph InfoVis papers.
Canvas
I implemented a new Canvas class, focusing on performance and usability. The Canvas class is more like a Canvas Widget, since it creates a cross-browser canvas tag and a label div container, wrapped in a main div element. This way, labels are relative to the canvas element and not absolute positioned, like they were on previous versions. I'd like to thank the people in this thread for providing nice ideas for implementing the Canvas class. This canvas class makes also the Spacetree visualization cross browser, working perfectly well in IE6+. Prior to version 1.0.8a, you had to put a canvas tag and a div label container in your html to create a new visualization. From version 1.0.8a this is no longer needed: you just have to include a visualization div container, like this:<div id="infovis"></div>//Create a new canvas instance.
var canvas = new Canvas('mycanvas', {
//Where to inject canvas. Any HTML container will do.
'injectInto':'infovis',
//Set width and height, default's to 200.
'width': 900,
'height': 500,
//Set canvas styles.
'styles': {
'fillStyle': '#ccb',
'strokeStyle': '#ccb'
}
});- injectInto: The id of the div where you want to inject the canvas widget
- width, height: Width and height of the canvas widget. Default's to 200
- styles: an object containing specific canvas styles. If you want to know more about canvas styles you can read this article.
<div id="infovis">
  <div id="mycanvas" style="position:relative;">
    <canvas id="mycanvas-canvas" width=900 height=500
    style="position:absolute; top:0; left:0; width:900px; height:500px;" />
    <div id="mycanvas-label"
    style="overflow:visible; position:absolute; top:0; left:0; width:900px; height:0px">
    </div>
  </div>
</div>//Create a new canvas instance.
var canvas = new Canvas('mycanvas', {
//Where to inject canvas. Any HTML container will do.
'injectInto':'infovis',
//Set width and height, default's to 200.
'width': 900,
'height': 500,
//Set a background color in case the browser
//does not support clearing a specific area.
'backgroundColor': '#222',
//Set canvas styles.
'styles': {
'fillStyle': '#ccb',
'strokeStyle': '#ccb'
}
});//Create a new canvas instance.
var canvas = new Canvas('mycanvas', {
//Where to inject the canvas. Any div container will do.
'injectInto':'infovis',
//width and height for canvas. Default's to 200.
'width': 900,
'height':500,
//Canvas styles
'styles': {
'fillStyle': '#ccddee',
'strokeStyle': '#772277'
},
//Add a background canvas for plotting
//concentric circles.
'backgroundCanvas': {
//Add Canvas styles for the bck canvas.
'styles': {
'fillStyle': '#444',
'strokeStyle': '#444'
},
//Add the initialization and plotting functions.
'impl': {
'init': $empty,
'plot': function(canvas, ctx) {
var times = 6, d = Config.levelDistance;
var pi2 = Math.PI*2;
for(var i=1; i<=times; i++) {
ctx.beginPath();
ctx.arc(0, 0, i * d, 0, pi2, true);
ctx.stroke();
ctx.closePath();
}
}
}
}
});Treemap
I implemented the Strip layout for the Treemap, in addition to the Squarified and Slice and Dice layout algorithms provided in previous versions of the library. I updated the treemap example to impement different tiling algorithms. Use the dropdown box at the left of the screen to change the current layout. Why another tiling algorithm? Well, as the Wikipedia explains: To create a treemap, one must define a tiling algorithm, that is, a way to divide a rectangle into sub-rectangles of specified areas. Ideally, a treemap algorithm would create rectangles of aspect ratio close to one; would preserve some sense of the ordering of input data; and would change only slowly when the underlying data changes slowly. Unfortunately, these properties have an inverse relationship. The Strip tiling algorithm provides a good compromise between order, stability and aspect ratio values. More precisely, the three techniques implemented in the JIT can be classified as follows:- Slice and Dice: Ordered, very high aspect ratios, stable
- Squarified: Unordered, lowest aspect ratios, medium stability
- Strip: Ordered, medium aspect ratios, medium stability
Spacetree
I implemented two new layouts for the Spacetree, bottom and right layouts. You can change the Spacetree layouts by using the dropdown box at the left of the visualization. The bottom layout could be pretty useful for making family trees or things like that :). Anyway, another good thing of the Spacetree is that it works for IE6+ now (thanks to the new Canvas implementation). Some cleanup regarding the plotting algorithms and how labels were created was done, please check the ST quick tutorial to understand exactly what changed.RGraph
I implemented the second animation constraint mentioned in the RGraph paper: child ordering. This constraint decreases edge crossing during animations, making animations more intuitive and graspable by the viewer. The child ordering constraint consists in mantaining child ordering for the parent of the clicked node, that way we can decrease the edge crossing cases during animations: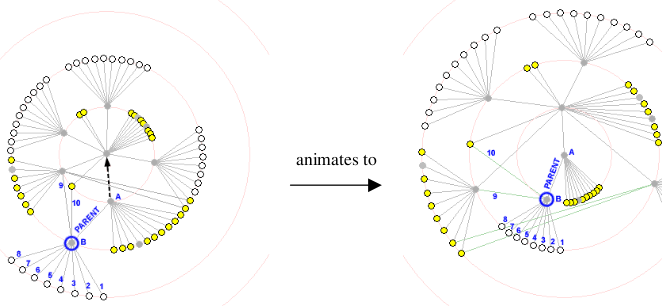 I didn't make a new example for this, but you should see the difference when comparing it with the examples packaged in previous versions of the library.
Hypertree
I did some Cleanup of the Hypertree code, and stripped off the Mouse class and the prepareCanvasEvents method. Those kind of things can be easily implemented with DOM/AJAX frameworks like Mootools or JQuery. The hypertree example packaged with the library shows a possible workaround for prepareCanvasEvents://optional: set an "onclick" event handler on the canvas tag to animate the tree.
var mycanvas = $('mycanvas');
var size = canvas.getSize();
mycanvas.addEvent('click', function(e) {
var pos = mycanvas.getPosition();
var s = Math.min(size.width, size.height) / 2;
ht.move({
'x': (e.page.x - pos.x - size.width / 2) / s,
'y': (e.page.y - pos.y - size.height / 2) / s
});
});